In today’s ApplyInsights, I’ll be taking a look at growth in Canada’s Post-Graduation Work Permit Program (PGWPP). The PGWPP allows students who have graduated from a designated learning institution (DLI) to remain in Canada on a post-graduation work permit (PGWP) and obtain valuable Canadian work experience.
Skilled Canadian work experience gained through the PGWPP helps graduates qualify for permanent residency (PR) in Canada. For students who hope to gain PR and eventually become Canadian citizens, the program is a critical step on their immigration journey.
Here’s what this blog post will cover:
- Overall growth in the PGWPP for all source countries
- Top source countries for PGWP holders, and how they’re trending
- Source countries with exceptionally high and low rates of PGWPP enrollment
For more information on the PGWPP, check out our guide for prospective applicants.
Overall Growth in the PGWPP
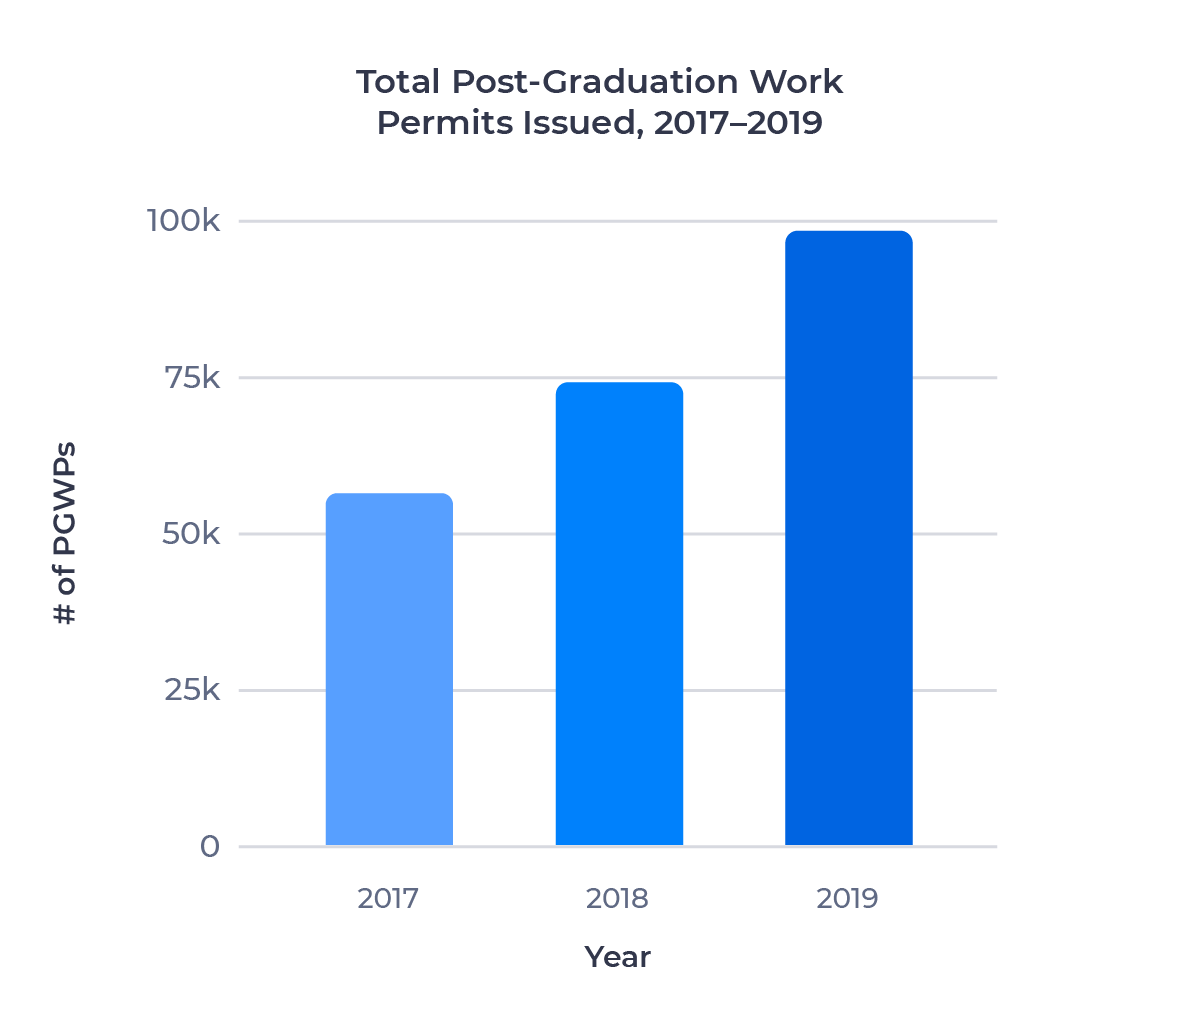
Enrollment in the PGWPP grew steadily from 2017 to 2019, as the chart below shows:
A key question in examining PGWPP data is whether interest in the program is shifting, or whether the data is reflecting fluctuations in the number of students coming to Canada. In this case, we can attribute the faster growth rate in the PGWPP to a decline in the growth rate for the number of study permits issued. From 2015 to 2017, the number of Canadian study permits issued grew at almost twice the rate we saw from 2017 to 2019. It’s primarily the students who were part of that large 2015 to 2017 cohort that have graduated over the past two years and moved into the PGWPP.
Top Source Countries for the PGWPP
It should come as no surprise that the list of top source countries for the PGWPP is similar to the list of top source countries for study permit holders. In fact, of the top 10 source countries for students who were issued new study permits in 2019, 9 ranked in the top 10 for PGWPs as well.
The table below shows the top 10 source countries by PGWPs issued in 2019, as well as the growth in the number of PGWPs issued between 2018 and 2019 for citizens of those countries. It also shows where those countries ranked among source countries for new study permits issued.
| PWGP Rank | Study Permit Rank | Country | PGWPs Issued 2019 | Change 2018–2019 |
|---|---|---|---|---|
| 1 | 1 | India | 53,539 | +60.0% |
| 2 | 2 | China | 14,022 | -3.7% |
| 3 | 3 | France | 2,609 | +6.6% |
| 4 | 5 | Brazil | 2,431 | +22.3% |
| 5 | 4 | South Korea | 2,185 | +3.3% |
| 6 | 9 | Vietnam | 1,934 | +97.1% |
| 7 | 14 | Nigeria | 1,875 | +54.6% |
| 8 | 6 | Iran | 1,282 | +24.5% |
| 9 | 10 | Philippines | 1,125 | +56.3% |
| 10 | 8 | USA | 914 | +18.1% |
Let’s take a look at a few of these countries in detail.
India
India alone was responsible for a remarkable 53,539 PGWPs issued in 2019. That represented 54.4% of all PGWPs issued, up from 33.4% in 2017. This outpaced India’s still-formidable share of the Canadian study permit market, which hit an all-time high of 43.0% in 2019.
Just as remarkable was the growth in India’s PGWP count, which increased 60.0% last year on the heels of 77.1% growth in 2018. This is a clear echo of the 65 to 75% year-over-year growth in study permits issued to Indian nationals in 2016 and 2017.
It’s well known that many Indian students see studying abroad as a first step in their immigration journey. This makes the PGWPP a critical piece of the value proposition for Indian students when it comes to studying in Canada. The data underscores how much Indian nationals have leveraged the program. Moreover, because Indian students have been the driving force behind Canada’s expanding international student market over the last five years, it reinforces how critical the PGWPP program has been to the ongoing growth and success of international education in Canada.
Indian enrollment in Canada has been hit hard by the COVID-19 pandemic. But I’m confident that the presence of the PGWPP, and the changes the government has implemented to help it meet changing student needs during the pandemic, will ensure Canada remains a top destination for Indian students moving forward.
China
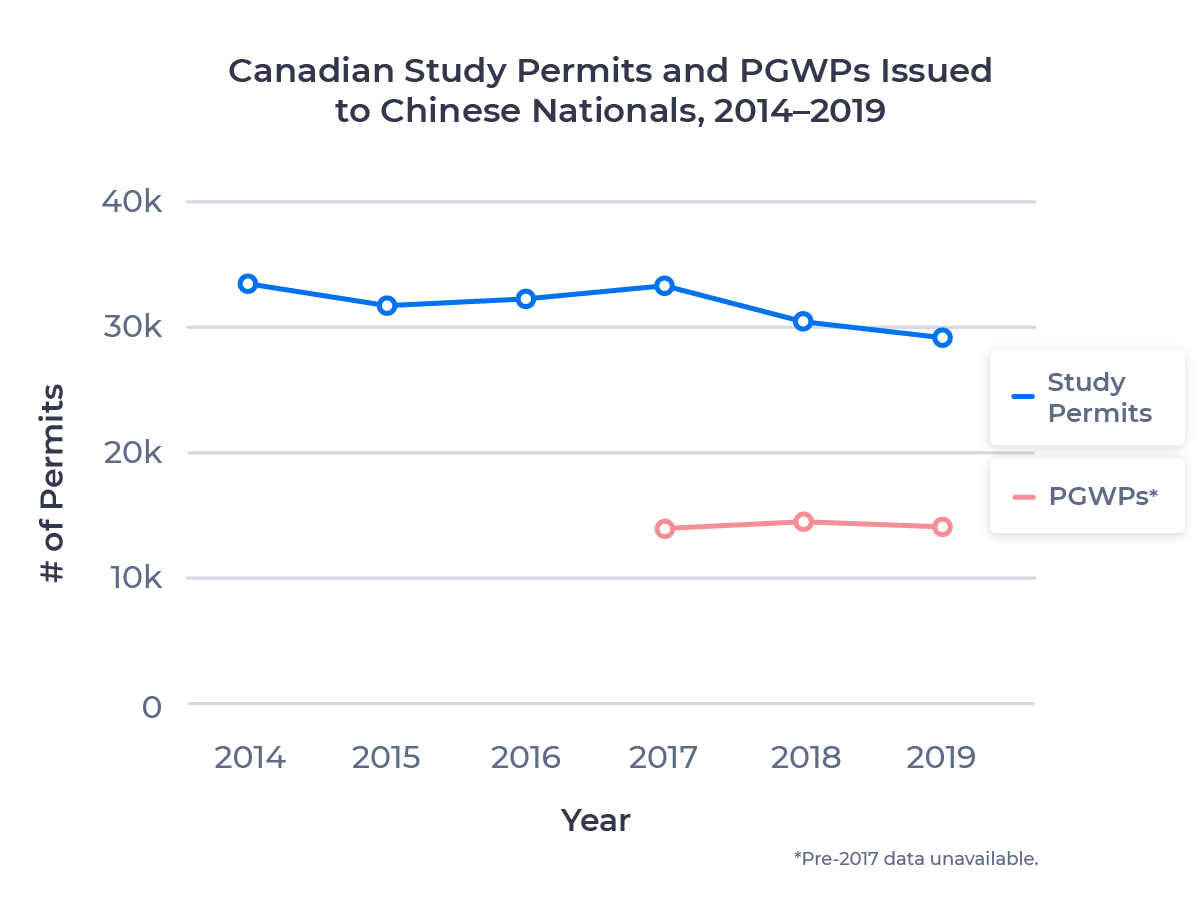
China stands out among the top 10 source countries for PGWPP enrollment as the only country that saw a net decrease in PGWPs issued between 2018 and 2019. This all but erased a minor 3.9% increase over the previous year. China accounted for 14.2% of all PGWPs issued in 2019, down from 24.8% in 2017.
China is a university-focused market, with more than three times the number of students at Canadian universities than Canadian colleges. In this case, it’s worth examining study permit data back even further to account for the longer duration of university programs.
Unfortunately, data is only available back to 2014. Let’s take a look:
As we discussed in our previous ApplyInsights on the Chinese market, competition from the UK and China’s growing domestic post-secondary sector has contributed to the decline in Chinese students in Canada, and I expect this to continue. Look for PGWP numbers for China to continue to trend downward as well, hastened by the effects of the COVID-19 pandemic.
Vietnam
The number of PGWPs issued to Vietnamese students nearly doubled in 2019, from 981 to 1,934. This echoed a massive spike in new study permits issued in 2016 and 2017 spurred by the success of the Canada Express Study Program (CES). CES was an Immigration, Refugees and Citizenship Canada (IRCC) pilot initiative that ran from 2016 to 2018 and facilitated visa processing for Vietnamese students looking to study at participating colleges in Canada.
Study permit approval rates for Vietnamese students fell almost 30% between 2017 and 2019, precipitating a slowdown and eventually a decline in study permits issued. Between this shift and the effects of COVID-19, I expect we’ll see a significant decline in the number of PGWPs issued to Vietnamese nationals over the next few years.
Markets with High Levels of PGWPP Enrollment
Let’s turn our attention to which countries have a large ratio of PGWPs to new study permits issued. To help account for the time lag between students receiving their study permits and their PGWPs, I’ve used 2019 PGWP numbers and 2017 study permit numbers in the table below:
| Rank | Country | PGWPs Issued 2019 | Study Permits Issued 2017 | Ratio |
|---|---|---|---|---|
| 1 | Cameroon | 496 | 467 | 1.06 |
| 2 | Tunisia | 619 | 630 | 0.98 |
| 3 | Pakistan | 780 | 810 | 0.96 |
| 4 | Senegal | 334 | 353 | 0.95 |
| 5 | Nigeria | 1,875 | 2,103 | 0.89 |
| 6 | Jamaica | 637 | 764 | 0.83 |
| 7 | Algeria | 522 | 627 | 0.83 |
| 8 | India | 53,539 | 67,578 | 0.79 |
| 9 | Ivory Coast | 304 | 394 | 0.77 |
| 10 | DRC | 164 | 226 | 0.73 |
| *Minimum 500 study permits issued in 2019 | ||||
This is strictly an approximation, as it doesn’t take into account the average length of studies for each country, which can vary significantly. It also doesn’t account for the attrition rate for study permit holders.1 Nevertheless, it gives an idea of which countries have the highest rates of PGWPP enrollment. For comparison, the average ratio for all countries is 0.51.
African and South Asian countries dominate the list.2 Large proportions of students from these regions are clearly choosing to study in Canada because of the PGWPP and the pathway to PR that it offers.
Markets with Low Rates of PGWPP Enrollment
There is a striking contrast between the list above and the list of countries with the lowest ratios of PGWPs to study permits, as the table below shows:
| Rank | Country | PGWPs Issued 2019 | Study Permits Issued 2017 | Ratio |
|---|---|---|---|---|
| 1 | Germany | 113 | 1,819 | 0.06 |
| 2 | Spain | 91 | 1,316 | 0.07 |
| 3 | Japan | 348 | 4,998 | 0.07 |
| 4 | UK | 139 | 1,678 | 0.08 |
| 5 | USA | 914 | 5,621 | 0.16 |
| 6 | Mexico | 720 | 4,71 | 0.17 |
| 7 | Turkey | 421 | 2,252 | 0.19 |
| 8 | Thailand | 108 | 516 | 0.21 |
| 9 | South Korea | 2,185 | 9,733 | 0.22 |
| 10 | Italy | 218 | 965 | 0.23 |
| *Minimum 500 study permits issued in 2019 | ||||
In particular, we see tiny ratios of PGWPs to study permits issued for the top four countries. While not as geographically uniform as the list above, this list includes many of the world’s wealthiest nations. Notably, five of the six non-Canada members of the Group of Seven, or G7, are listed.
It’s not surprising that these countries have lower rates of PGWPP enrollment. Citizens of the G7 countries, in particular, are often able to get Canadian work permits without a Canadian education, so the PGWP path has less value for those students.
The Future of the PGWPP
The numbers make it clear: the PGWPP is a key driver of Canada’s international education market. It’s a critical piece of the value proposition not just for students from major source markets like India, but for students coming from less mature markets as well. With some of Canada’s largest source markets, such as China and France, experiencing slower growth or even declining, these less mature markets will be where future growth in international education in Canada comes from.
The government has recently made changes to the PGWPP to address student concerns in light of COVID-19 travel restrictions. This demonstrates the government’s commitment to the program, and its recognition of the PGWPP’s importance to Canada’s international student market. While we can expect a ripple effect on PGWPP numbers over the next few years due to the pandemic-related decline in enrollment, we should also see robust increases in subsequent years due to policy changes that have placed international students at the forefront.
Subscribe to ApplyInsights
Sign up for the latest insights on international education.
 Meti Basiri
Co-Founder and Chief Marketing Officer (CMO)
Meti is driven by the belief that education is a right, not a privilege. In his role as Co-Founder and Chief Marketing Officer (CMO) at ApplyBoard, he leads the International Recruitment, Partner Relations, Sales Enablement, Sales Operations, and Marketing teams along a shared mission to educate the world. Meti has been instrumental in building partnerships with 1,200+ educational institutions across North America, the United Kingdom, and Australia. Working with over 4,000 international recruitment partners, ApplyBoard has assisted more than 120,000 students in their study abroad journey.
Meti was honoured in 2019 by Forbes, being named to three Top 30 Under 30 lists, including Education, Immigrants, and Big Money. Follow Meti on LinkedIn for more access to ApplyInsights and key industry trends.
FOOTNOTES:
1. Unfortunately, data for the number of graduates by year is not available.
2. Sri Lanka, Ghana, and Nepal had the next three highest ratios.


